
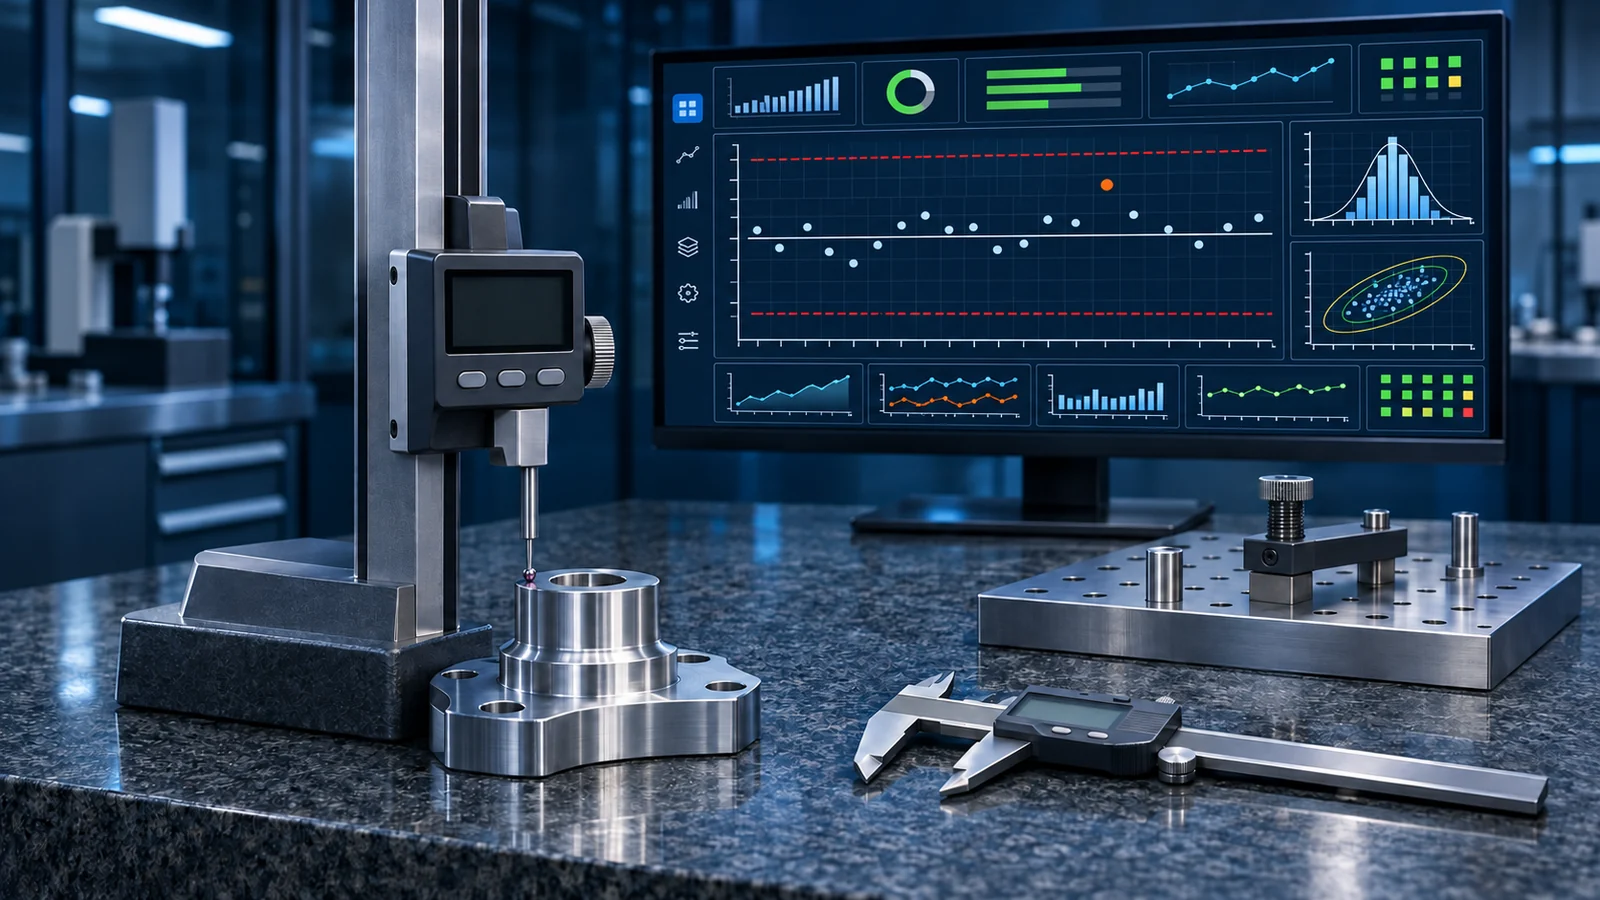
SPC Statistical Process Control
Move from final pass/fail decisions to process-stability monitoring and capability evidence
A proprietary SPC statistical engine connects gauges and quality data to provide control charts, run-rule detection, process capability, measurement-system analysis, and layered reporting. It helps identify process abnormalities and improvement opportunities without replacing quality accountability or presenting AI quality prediction as an existing standard capability.
Good fit
Best-Fit Scenarios
- • Production processes requiring ongoing stability monitoring of critical dimensions, weights, performance measures, or defect counts.
- • Quality teams with inspection data whose control charts, capability analysis, and exception responses still rely on fragmented spreadsheets.
- • Factories that need consistent control plans, run rules, and stratified analysis before rolling out to multiple lines.
- • Operations that want to link gauges, MES, and process parameters into a verifiable quality-evidence chain.
Scenarios Requiring Separate Assessment
- • Projects with insufficient sample sizes, measurement frequency, or data context that nevertheless require reliable capability conclusions immediately.
- • Expectations that SPC will replace all inspection, quality planning, laboratory management, or a complete QMS.
- • Sites with unevaluated measurement systems and mixed use of specification and process control limits that are unwilling to improve basic data processes.
- • Projects expecting the system to predict every quality problem, identify root causes automatically, or adjust equipment parameters without authorization.
Lean manufacturing context
Core capabilities
Automatic Quality-Data Collection
Connect gauges, inspection stations, MES, or quality databases while retaining sample values, timestamps, products, operations, batches, and other context to reduce duplicate transcription.
Control-Plan Configuration
Configure data sources, sampling methods, subgroups, specification limits, control-limit calculations, and stratification dimensions by characteristic, with different usage rules for pilot and stable production.
Multiple Control-Chart Types
Supports X-bar and R, X-bar and S, individuals and moving range, EWMA, CUSUM, and attribute charts including P, NP, C, and U charts, selected according to data type.
Nelson Rules and Signal Tracking
Identify abnormal patterns using Nelson rules one through eight, marking triggered points and rules and retaining control-limit versions and run-rule records for review.
Process-Capability Analysis
Provide Cp, Cpk, Cpm, Pp, Ppk, and graphical analysis, with guidance on interpretation prerequisites such as stability, sample size, and distribution assumptions.
Non-Normal and Multivariate Analysis
Support non-normal capability-analysis approaches such as Box-Cox and Johnson, plus Hotelling T² multivariate monitoring, with specific methods configured to data characteristics and project scope.
Gage R&R Measurement-System Analysis
Organize measurement-system analysis data and results to help assess repeatability, reproducibility, and variance components, providing evidence of measurement reliability for control-chart and capability conclusions.
Exception Response and Quality Reports
Link run-rule signals to responses, causes, actions, and review records, and generate trends and summary reports by product, operation, equipment, or shift.
Data and system architecture
Measurement and Data-Source Layer
Connect gauges, test equipment, manual-inspection terminals, and existing business systems, defining measurement units, sample identifiers, specification versions, and time sources.
Quality-Data Governance Layer
Validate samples, subgroups, and context fields, and manage missing, duplicate, revised, and stratification information so statistical calculations are not based on incomparable data.
SPC Statistical-Engine Layer
Perform control-limit, control-chart, run-rule, capability, non-normal, multivariate, and measurement-system analyses while retaining parameter and algorithm configurations.
Application and Response Layer
Provide engineering analysis, shop-floor dashboards, exception response, and reports, with optional MES or quality-workflow integration that does not automatically replace authorized release.
- Data interfaces for digital gauges, measurement equipment, and test benches
- Serial, USB, or verified communication methods provided by equipment vendors
- MES product, work-order, operation, and inspection-result interfaces
- SCADA, OPC UA/DA, or process-database interfaces
- ERP/quality-system material, specification, and inspection-result interfaces
- Controlled CSV/Excel import and historical-data migration
- REST APIs, database views, and agreed report exports
Implementation
- 1
Characteristic and Data Diagnosis
Select critical-to-quality characteristics and examine data types, sampling, subgroups, measurement systems, specification versions, and the availability of existing historical data.
- 2
Control-Plan Design
Define control charts, run rules, control-limit phases, capability methods, and stratification dimensions, making clear that a statistical signal is not a nonconforming-product decision.
- 3
Data Integration and Calculation Validation
Connect gauge or business data and verify calculations, charts, rule triggering, and permissions against representative examples, retaining validation records.
- 4
Exception-Response Pilot
Connect run-rule signals to shop-floor responses and cause reviews, check for missed signals, misuse, and overadjustment, and train engineering and production roles.
- 5
Review and Phased Rollout
Review control plans periodically after stable operation. New products and processes require renewed validation of measurement, distributions, and control limits rather than mechanical copying.
Deliverables
- ✓ Critical characteristics, measurement data sources, and SPC control plans
- ✓ Data dictionary for samples, subgroups, specifications, and stratification fields
- ✓ SPC statistical-analysis and dashboard functions configured to the agreed scope
- ✓ Validation records for control-chart, run-rule, capability, and MSA calculations
- ✓ Documentation of exception-response, cause-review, and verification processes
- ✓ Gauge or business-system interfaces and data-import templates
- ✓ User training, analytical definitions, and maintenance documentation
Frequently asked questions
How does SPC differ from final inspection?
Final inspection primarily determines whether a product meets specifications, while SPC examines whether a process remains stable over time and shows abnormal patterns. Control limits come from process data and specification limits from product requirements. They cannot be interchanged, and a stable process does not replace necessary product inspection.
Can we rely on Cpk when the process is unstable?
A conclusion should not rest on Cpk alone. First examine the measurement system, data distribution, and process stability, and distinguish short-term from long-term indices. The system provides calculations and graphical evidence, but engineering interpretation still requires sampling context and process knowledge.
Does a control-chart run-rule signal mean the product is nonconforming?
Not necessarily. A run-rule signal indicates a possible special cause in the process and requires investigation of measurement, equipment, materials, methods, and environment under the response plan. Product disposition should follow specifications, inspection, and authorized quality workflows, not chart colors alone.
How are non-normal data handled?
First analyze the source of non-normality and the data-generating mechanism, then select transformations, non-normal capability methods, or other monitoring approaches based on applicability. The system supports approaches such as Box-Cox and Johnson, but mechanical transformation merely to obtain attractive indices is not recommended.
Does it include AI root-cause analysis or quality prediction?
The existing standard scope covers statistical analysis, signal detection, and closed-loop exception handling, not mature AI root-cause analysis or quality-prediction commitments. These directions can be jointly validated once the data foundation and use case are clear, and must not be conflated with SPC statistical evidence.
Related products
Factory Energy Management and Energy Analysis
Break down utility bills by area, system, equipment, and product to build an explainable energy baseline
Batching and Feeding Error Proofing with Lot Traceability
Turn recipe requirements into executable checks, weighing steps, and batch records on the shop floor
Production-Line MES and Quality Traceability
Ground work-order execution in evidence, record process exceptions, and make product genealogy traceable
Related insights
SPC and Process Capability: Establish Stability Before Discussing Cp/Cpk
The direct answer for SPC and process capability is to use control charts first to determine whether a process is statistically stable, then calculate capability indices only when specifications, distribution and the measurement system are appropriate. Cp = (USL − LSL) ÷ (6σwithin), and Cpk = min[(USL − μ) ÷ (3σwithin), (μ − LSL) ÷ (3σwithin)]. Pp and Ppk use the overall standard deviation rather than the within-subgroup standard deviation. Control charts answer whether special causes are present; capability indices describe process spread and centering relative to specifications. One cannot replace the other.
Forward and Backward Traceability: Connect Product Identity and Process Evidence in One Graph
The direct answer for forward and backward traceability is to support both query directions around the same identity relationships. Backward tracing starts with a finished product or lot and identifies the materials used, equipment and processes involved, operators and quality results. Forward tracking starts with a suspect material, equipment item, tool or process abnormality and identifies potentially affected work in process and finished goods. Both share one event chain; they are not two separately built reports.
The Seven Wastes of Lean Production: From Shop-floor Identification to Data-supported Improvement
The direct answer for the seven wastes is to classify activities that do not create customer value as overproduction, waiting, transportation, overprocessing, inventory, motion and defects, then use shop-floor observation and process data to locate where they occur, how long they last and what triggers them. Classification alone does not improve anything. Waste moves from being seen to being reduced only when it is connected to ownership, standard work, abnormality handling and a regular review cadence.
Build a trusted SPC loop around one critical characteristic
Verify measurement, sampling, and data context before selecting control charts and response rules, so statistical conclusions genuinely support process improvement.