
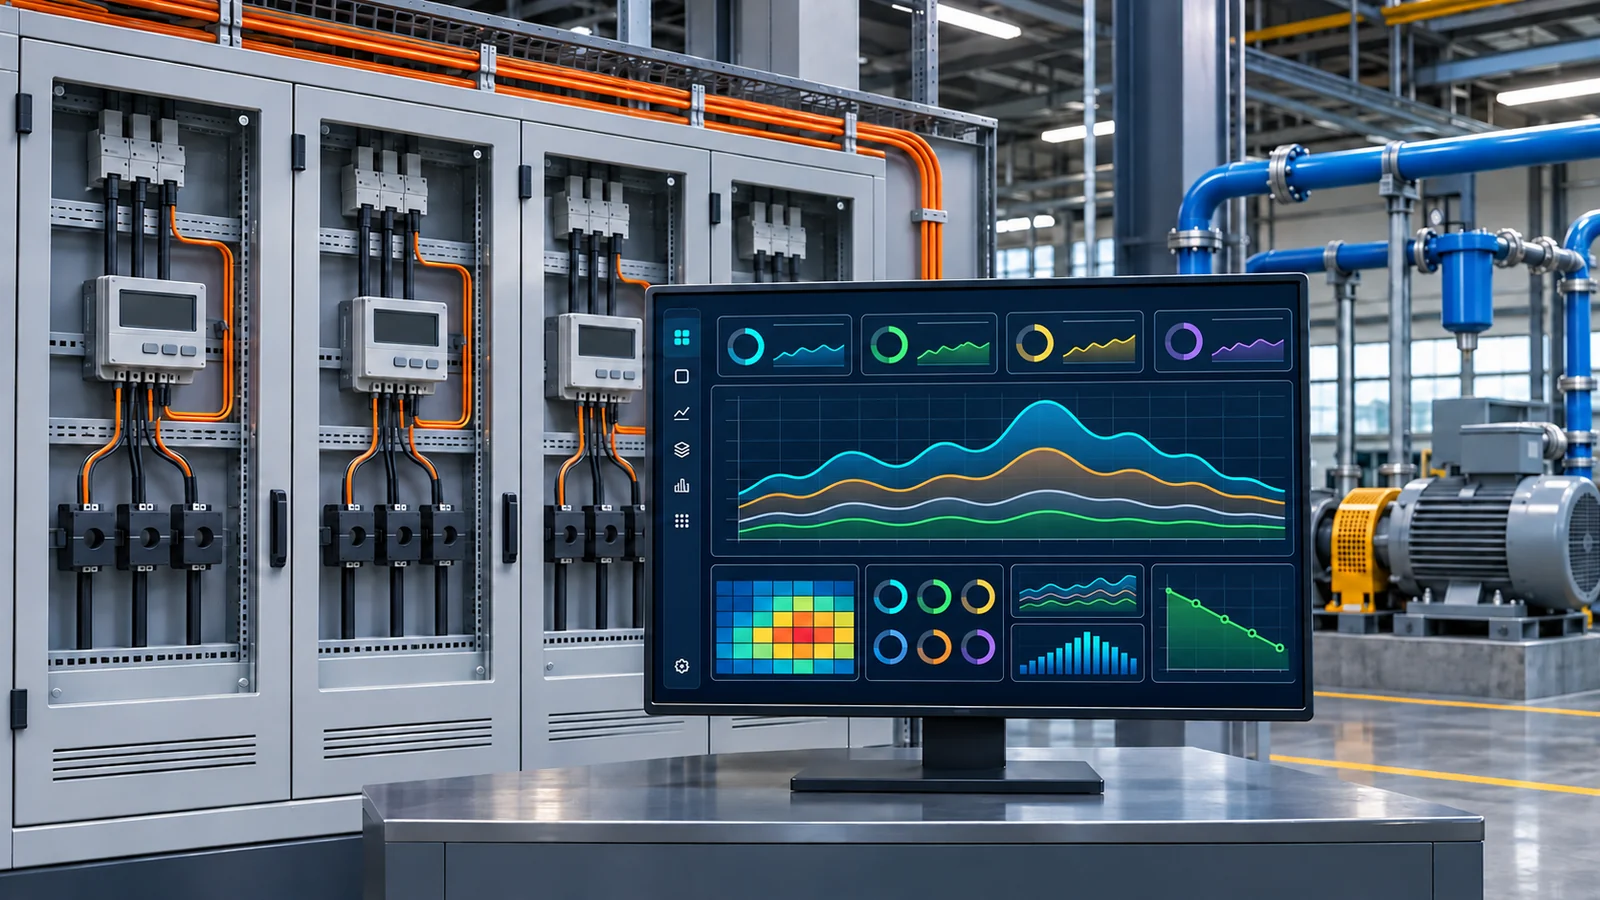
Factory Energy Management and Energy Analysis
Break down utility bills by area, system, equipment, and product to build an explainable energy baseline
Built on energy SCADA and facility-system integration, this solution brings together data for water, electricity, gas, HVAC, heating and cooling sources, and compressed air to support submetering, trends, energy use per unit, and benchmarking. On-site energy monitoring has an established deployment foundation. Web, cross-platform, and intelligent dispatch capabilities are assessed against the specific product and project scope rather than presented as uniformly mature offerings.
Good fit
Best-Fit Scenarios
- • Factories with basic metering that need a unified energy ledger by workshop, line, or utility system.
- • Sites with high or highly variable energy costs that need unit-consumption and load-profile analysis to identify improvement opportunities.
- • Projects with fragmented facility monitoring and energy reporting that need consistent acquisition, alarms, and analytical definitions.
- • Organizations that need a traceable data foundation for efficiency measures, carbon accounting, or green-manufacturing applications.
Scenarios Requiring Separate Assessment
- • Sites with only a plant-wide master meter that require accurate allocation to every machine without adding necessary metering or data boundaries.
- • Projects seeking a guaranteed fixed percentage of energy savings without establishing a baseline or accounting for changes in output and operating conditions.
- • Expectations that a general energy-monitoring platform can directly replace protection, fire-safety, or hard real-time safety controls.
- • Projects that treat full web coverage, cross-platform clients, AI dispatch, and unattended control as existing standard capabilities.
Lean manufacturing context
Core capabilities
Submetering and Energy Ledger
Organize water, electricity, gas, and other metering points by site, workshop, line, system, and major equipment, while managing multipliers, units, ownership relationships, and meter-reading conventions.
Energy SCADA and Integrated Facility Monitoring
Centralize energy-use status, operating parameters, trends, and alarms, with optional integration into facility monitoring for HVAC, heating and cooling sources, compressed-air stations, and pure-water or wastewater systems.
Energy Use per Unit Analysis
Associate energy data with work orders, production volumes, or shifts to calculate energy use per unit by product and reporting boundary, while flagging missing data, line stoppages, and abnormal intervals.
Peak, Off-Peak, and Load-Profile Analysis
Analyze consumption by tariff period, load curve, and production rhythm to identify improvement opportunities related to demand, idle consumption, and load shifting. Tariffs and rules are maintained by the customer or supplied through an interface.
Baselines and Like-for-Like Benchmarking
Select a representative period to establish a baseline and compare performance by product, output, shift, or necessary environmental conditions. Adjustment rationale is retained, and savings are not inferred directly from differences in total consumption.
Exception Alarms and Follow-Up Records
Configure notifications for limit violations, sudden changes, prolonged non-production energy use, and communication failures, and record acknowledgement, causes, and actions so alarms do not remain only on a screen.
Reporting and Carbon-Data Support
Produce submetering, unit-consumption, and benchmarking reports at agreed intervals. Energy data can support carbon accounting or green-manufacturing documentation, subject to separate confirmation of accounting boundaries and emission factors.
Data and system architecture
Metering and Facility Equipment Layer
Connect electricity and water meters, flowmeters, gas or steam metering, and systems such as HVAC, compressed air, and heating and cooling sources, while verifying metering accuracy and data availability.
Acquisition and Monitoring Layer
Acquire data through PLCs, gateways, OPC, or existing SCADA, handling quality codes, reconnection, and necessary buffering while preserving autonomous on-site control boundaries.
Energy Model and Analysis Layer
Build association models among energy media, organizations, equipment, and products to perform submetering, unit-consumption, baseline, peak and off-peak, and exception analysis.
Application and Integration Layer
Provide on-site monitoring, management views within the agreed scope, and reports, exchanging production, organizational, and analytical results with MES, ERP, or data platforms.
- Multifunction electricity meters, water meters, flowmeters, gas meters, and other metering instruments
- Modbus RTU/TCP, BACnet, and OPC UA/DA
- PLCs, energy gateways, and interfaces to existing facility SCADA
- MQTT, HTTP/REST, or message-based uplink interfaces
- MES work-order, product, production-volume, and shift-data interfaces
- ERP organization, cost-center, or energy-bill data interfaces
- Historian, report-export, and enterprise data-platform interfaces
Implementation
- 1
Metering-Point and Energy-Boundary Survey
Inventory energy media, meters, multipliers, organizational ownership, and facility systems, identifying imbalances between master and submeters and data that must be added.
- 2
Energy Model and Baseline Design
Define the submetering hierarchy, reporting periods, unit-consumption denominators, peak and off-peak rules, and exception thresholds, and select a representative baseline period.
- 3
Acquisition and Monitoring Integration
Connect meter and facility data, verify instantaneous and cumulative values, time granularity, and communication quality, and configure energy displays and alarms.
- 4
Production Association and Report Verification
Integrate work orders and production volumes, then validate unit consumption, balance differences, and non-production-period analysis so data gaps are not mistaken for savings.
- 5
Operating Routine and Measure Verification
Incorporate exception follow-up and efficiency measures into periodic reviews and verify them with like-for-like data. Control or dispatch optimization requires a separate safety assessment.
Deliverables
- ✓ Inventory of energy metering points, media, and organizational ownership
- ✓ Energy data model and documentation of unit-consumption definitions and baseline design
- ✓ Energy monitoring, analysis, and alarm functions configured to the agreed scope
- ✓ Integration-test records for meter, facility, and production-system interfaces
- ✓ Report templates for submetering, peak and off-peak use, unit consumption, and benchmarking
- ✓ Acceptance records for data quality, energy balances, and exception scenarios
- ✓ Operating and maintenance documentation with recommendations for verifying efficiency measures
Frequently asked questions
Can we analyze energy use per unit without comprehensive submetering?
Existing data can support an initial coarse-grained ledger, but it cannot accurately attribute consumption to lines or equipment outside the metering coverage. Implementation identifies metering boundaries and estimates, then refines unit consumption after necessary meters or allocation rules are agreed.
How much energy will the system save after go-live?
No savings percentage can be promised without a site-specific baseline. The platform provides metering, exception detection, and evidence for improvement. Actual results depend on equipment condition, production organization, execution of measures, and operating conditions, and must be verified using data with consistent boundaries and definitions.
What should we do if platform electricity data differs from the utility bill?
Check metering boundaries, instrument-transformer ratios, reading times, losses, power factor, and tariff components. An energy platform is generally used for process monitoring and analysis; whether it can support settlement depends on the metering system and statutory requirements.
Can the on-site, web, and cross-platform versions all be delivered off the shelf?
Not as a blanket assumption. On-site energy monitoring and SCADA have an established deployment foundation, the web-management scope must be assessed by project, and cross-platform implementations remain within development or joint-validation boundaries. The proposal specifies the delivery form, functions, and acceptance criteria for the current phase.
Does it support AI load forecasting or automatic dispatch optimization?
Load forecasting and general-purpose AI dispatch are not mature standard deliverables. Related large-model-assisted recommendations are limited to exploratory or shadow-validation use, are advisory only, and require human confirmation. They must not be described as unattended automatic dispatch.
Can the energy system start and stop facility equipment remotely?
This can be assessed by project but must be defined separately from monitoring. Remote control requires explicit rules for local autonomy, permissions, interlocks, communication failure, and emergencies. General energy-analysis screens cannot replace safety controls and protection systems.
Related products
Batching and Feeding Error Proofing with Lot Traceability
Turn recipe requirements into executable checks, weighing steps, and batch records on the shop floor
Production-Line MES and Quality Traceability
Ground work-order execution in evidence, record process exceptions, and make product genealogy traceable
OEE and Andon Visualization
Go beyond a single metric by breaking losses into actionable causes and accountability loops
Related insights
How to Calculate Unit Energy Consumption: Align Boundaries Before Discussing Energy Savings
The direct answer for unit energy consumption is to divide energy consumed within a clearly defined boundary by the corresponding useful output over the same reporting period: Unit Energy Consumption = Energy within the Boundary ÷ Output within the Boundary. The formula is simple; the difficulty lies in whether utilities and idling are included, whether Total Count or Good Count is used, how multiple products are converted, and whether product, output, environment and operating conditions are normalized for comparison. Without these definitions, a rise or fall may reflect nothing more than a changed accounting basis.
How to Collect Value-stream Data: Make the Current-state Map a Verifiable Improvement Baseline
The direct answer for value-stream data collection is to select a product family and start/end boundaries first, record cycle time, changeover, available time, work in process, quality and batching rules along material and information flows, and then calibrate system data with shop-floor observation. A value-stream map is not an MES report drawn as a flowchart. It explains how demand triggers production, where materials wait, where information becomes distorted, and which losses belong in future-state design.
The Seven Wastes of Lean Production: From Shop-floor Identification to Data-supported Improvement
The direct answer for the seven wastes is to classify activities that do not create customer value as overproduction, waiting, transportation, overprocessing, inventory, motion and defects, then use shop-floor observation and process data to locate where they occur, how long they last and what triggers them. Classification alone does not improve anything. Waste moves from being seen to being reduced only when it is connected to ownership, standard work, abnormality handling and a regular review cadence.
Start with an explainable energy balance
Begin with metering boundaries, production data, and abnormal periods to confirm which consumption can be measured, analyzed, and followed through to improvement.