
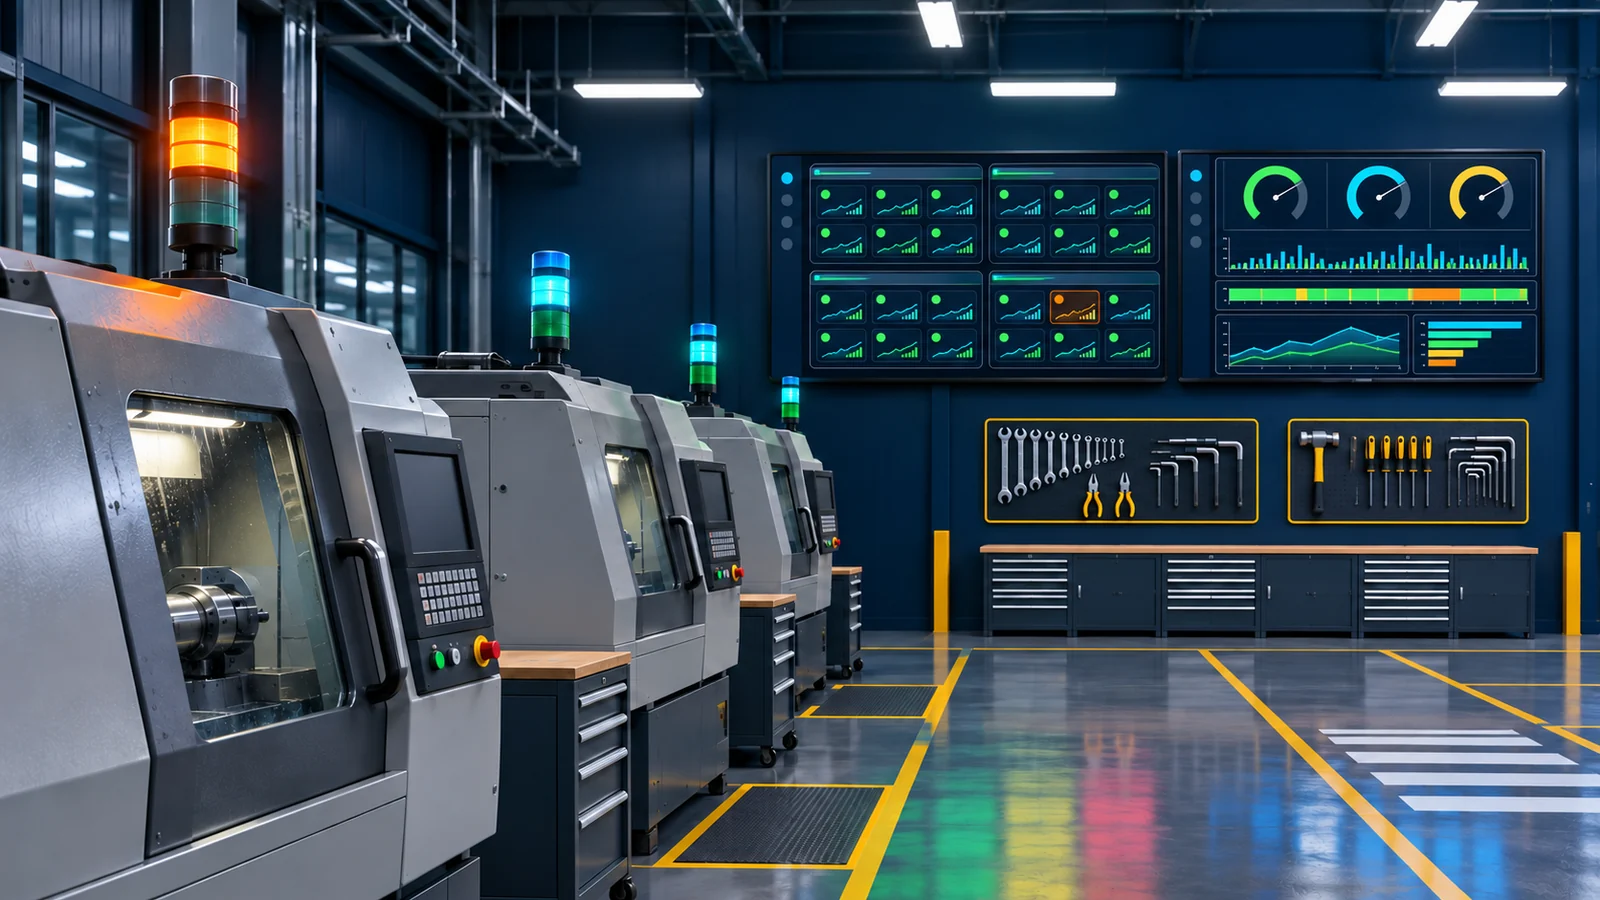
OEE and Andon Visualization
Go beyond a single metric by breaking losses into actionable causes and accountability loops
Connect equipment status, production counts, and quality data to build an explainable OEE loss tree by line and bring andon events into response, handling, and review workflows. The system works with existing MES, SCADA, and maintenance processes; a complete TPM or predictive-maintenance platform is not included by default.
Good fit
Best-Fit Scenarios
- • Lines with substantial equipment populations and no consistent records of changeover, micro-stop, waiting, and speed losses.
- • Workshops with equipment signals or SCADA that want to add OEE analysis and an exception-response mechanism.
- • Factories that need consistent production calendars, downtime classifications, and metric definitions across lines before comparative reviews.
- • Teams that want to evolve andon from a shop-floor alert into event records, escalation notifications, and a team-based improvement loop.
Scenarios Requiring Separate Assessment
- • Projects seeking only an attractive OEE figure without agreeing on production calendars, cycle times, and downtime-cause definitions.
- • Equipment with no state or count source where neither additional acquisition points nor manual event confirmation is permitted.
- • Expectations that this product will directly provide complete TPM, spare-parts, maintenance work-order, and full asset-lifecycle management.
- • Projects expecting OEE data to diagnose every fault root cause automatically or directly predict remaining equipment life.
Lean manufacturing context
Core capabilities
Automatic Equipment-State Acquisition
Obtain running, idle, fault, production-count, and necessary manual events from PLCs, SCADA, or a data hub, with state-determination logic confirmed machine by machine according to the process.
Configurable OEE Definitions
Configure calendars, shifts, planned downtime, ideal cycle times, and good-part rules, retaining calculation inputs and adjustment records to prevent each factory from calculating OEE differently.
Line and Machine Loss Analysis
Drill down from line OEE to equipment, shifts, products, and causes, distinguishing faults, changeovers, waiting, micro-stops, reduced speed, and quality losses, with support for observing bottleneck relationships.
Andon Events and Response Timing
Unify automatic equipment alarms and manual calls as events, recording type, location, response, recovery, escalation, and notes, with links to shop-floor audible, visual, or display terminals.
Micro-Stop and Short-Exception Aggregation
Identify short interruptions using configured thresholds and present them in aggregate, combining equipment states and operator confirmation to distinguish genuine micro-stops, normal process intervals, and signal chatter.
Shift Reviews and Improvement Tracking
Generate loss lists, major exceptions, and cause distributions for daily team meetings, linking actions, owners, and review conclusions. A complete maintenance work-order process can be added as a project extension.
Multi-Level Visualization
Provide role-specific dashboards for stations, lines, workshops, and management, supporting real-time status, historical trends, and heat maps instead of giving every role the same large display.
Data and system architecture
Shop-Floor Signals and Interaction Layer
PLCs, equipment controllers, andon buttons, audible and visual terminals, and station entries collectively provide states and exception events, with manual procedures retained for communication outages.
Acquisition and Event-Processing Layer
The data hub handles protocol adaptation, state calculation, debouncing, time alignment, and event distribution. Offline-resumption coverage is configured according to source-side buffering capability.
OEE and Andon Application Layer
Calculate metrics using equipment models, production calendars, and loss classifications; manage exception-response chains and review records; and retain raw events for verification.
Visualization and Collaboration Layer
Provide tiered views through web dashboards, shop-floor displays, and agreed messaging channels, exchanging necessary data with MES, quality, or maintenance systems.
- PLC and equipment-controller running, count, and fault signals
- SCADA, OPC UA/DA, and real-time database interfaces
- Modbus RTU/TCP and verified equipment communication protocols
- Andon buttons, audible and visual alarms, and shop-floor display terminals
- MES work-order, product, cycle-time, and good-part data interfaces
- Mobile messaging, email, or enterprise collaboration-platform notification interfaces
- REST API, database-view, or report-export interfaces
Implementation
- 1
Align Metric and Loss Definitions
Confirm calendars, cycle times, good parts, planned downtime, and cause classifications with production, equipment, and quality teams to resolve calculation disputes first.
- 2
Verify Equipment States and Constraints
Validate signal meanings, process intervals, and blocking and starvation relationships between machines, defining the interpretation boundaries of line and machine metrics.
- 3
Demonstration-Line Integration and Andon Configuration
Connect equipment states, counts, and exception sources, and configure response roles, escalation paths, dashboards, and manual-confirmation rules.
- 4
Parallel Verification and Team Pilot
Cross-check raw signals, shop-floor observations, and shift reports to correct signal chatter, misclassification, and omissions, without using early data directly for personnel appraisal.
- 5
Review Routine and Replication
Incorporate loss lists into daily meetings and improvement reviews, then replicate stable templates. Cycle times and state logic still require recalibration for each new line.
Deliverables
- ✓ Documentation of OEE definitions, production calendars, and loss classifications
- ✓ Equipment-state mappings, acquisition-point lists, and exception-source inventories
- ✓ OEE analysis and andon applications configured to the agreed scope
- ✓ Dashboards by line, machine, shift, and cause
- ✓ Operating rules for andon response, escalation, and team reviews
- ✓ Interface integration, parallel-verification, and agreed acceptance records
- ✓ User training, maintenance instructions, and recommendations for additional lines
Frequently asked questions
Can one standard OEE formula be applied everywhere?
The basic structure can be standardized, but production calendars, ideal cycle times, planned downtime, and quality-data sources must be defined for each process. Implementation focuses on making every input explainable and verifiable rather than producing an apparently consistent but incomparable number.
How can micro-stop data avoid contamination from signal chatter?
Combine sampling intervals, debounce thresholds, minimum durations, and process-interval rules, and retain raw events for spot checks. Thresholds are not universal constants and should be calibrated against shop-floor observation on a demonstration line.
How does andon differ from ordinary alarm notifications?
Andon addresses the complete accountability chain from occurrence through response, handling, recovery, and review; an ordinary notification is only one step. Automatic escalation, event-closure rights, and action recording can all be configured to shop-floor rules.
Does it include complete TPM or predictive maintenance?
A complete TPM management system is not included by default, and predictive maintenance is not promised. The system can provide equipment-loss data for autonomous maintenance, planned maintenance, and improvement activities, and can integrate with maintenance work orders by project. Life prediction and AI diagnostics require separate validation.
How much will OEE improve after go-live?
No improvement magnitude can be promised without a site baseline. The system first establishes consistent loss facts and response processes. Actual results depend on the constraint type, improvement actions, production organization, and execution quality, and should be assessed using like-for-like before-and-after data.
Related products
Factory Energy Management and Energy Analysis
Break down utility bills by area, system, equipment, and product to build an explainable energy baseline
Batching and Feeding Error Proofing with Lot Traceability
Turn recipe requirements into executable checks, weighing steps, and batch records on the shop floor
Production-Line MES and Quality Traceability
Ground work-order execution in evidence, record process exceptions, and make product genealogy traceable
Related insights
OEE Loss Tree: Trace the Three Factors to Actionable Losses
The direct answer for an OEE loss tree is to calculate Availability, Performance and Quality within the same Planned Production Time boundary, then break the gaps in those three factors down into downtime, minor stops, reduced speed, startup and quality losses. OEE = Availability × Performance × Quality, where Availability = Run Time ÷ Planned Production Time, Performance = Ideal Cycle Time × Total Count ÷ Run Time, and Quality = Good Count ÷ Total Count. The formulas must use the same equipment, period and production-count definitions.
Andon Response Loop: From Abnormality Calls to Review and Improvement
The direct answer for an Andon response loop is to give every abnormality a clear type, owner, status and escalation path, then complete discovery, calling, acknowledgment, arrival, treatment, recovery, closure and review in sequence. Lights and dashboards are only information entry points. Andon effectiveness depends on clear response ownership, consistent timing definitions, and whether abnormalities become evidence for sustained improvement.
OEE and TPM Working Together: How Metrics, Improvement Methods and Software Divide the Work
The direct answer for OEE–TPM synergy is to use OEE to identify and quantify equipment losses, TPM to organize autonomous maintenance, planned maintenance, skills and improvement activities, and software to preserve event, work-order and validation evidence. OEE is a metric, not a maintenance method. TPM is a management system, not a software module. Data collection and dashboards are supporting tools and do not automatically create maintenance results.
Start by defining the losses on one line
Begin with equipment signals, the production calendar, and the andon process to establish a verifiable data foundation on a demonstration line before setting improvement priorities.