
Energy Management
How to Calculate Unit Energy Consumption: Align Boundaries Before Discussing Energy Savings
The direct answer for unit energy consumption is to divide energy consumed within a clearly defined boundary by the corresponding useful output over the same reporting period: Unit Energy Consumption = Energy within the Boundary ÷ Output within the Boundary. The formula is simple; the difficulty lies in whether utilities and idling are included, whether Total Count or Good Count is used, how multiple products are converted, and whether product, output, environment and operating conditions are normalized for comparison. Without these definitions, a rise or fall may reflect nothing more than a changed accounting basis.
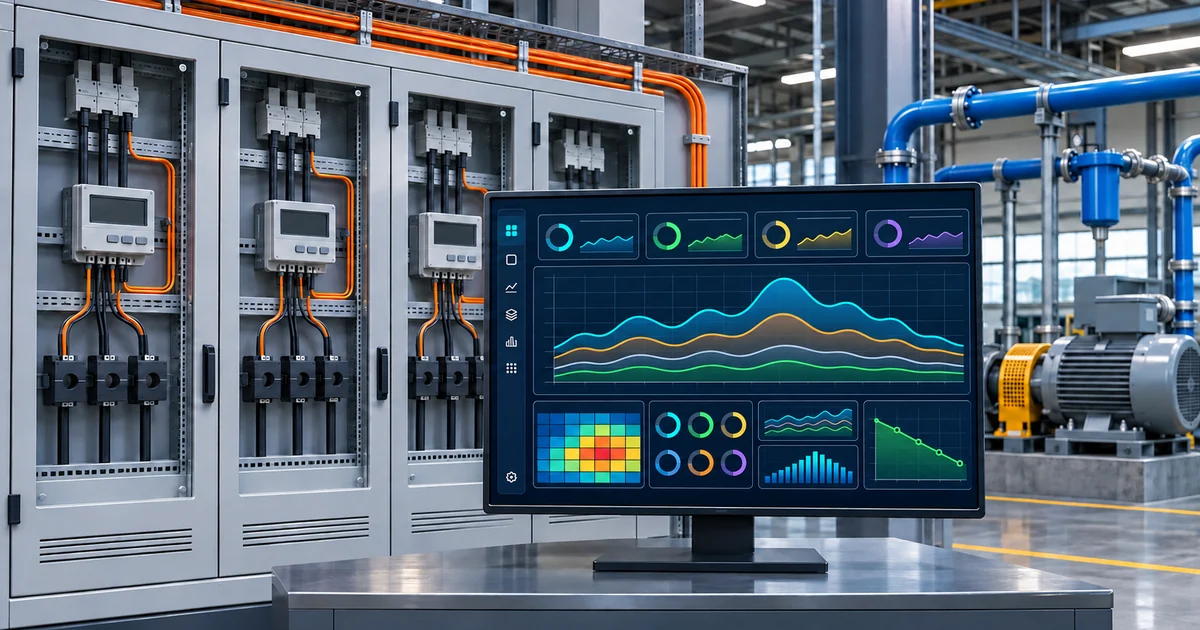
There Is Only One Formula, but Its Boundaries Must Be Written Down First
The basic formula is Eunit = Eboundary ÷ Qboundary, where Eboundary is energy consumed by the specified equipment, line, process or plant during the reporting period, and Qboundary is output corresponding to that energy boundary. Electricity, water, gas, steam and other energy types must retain their respective physical units. If standard-equivalent conversion or carbon accounting is required, use separately approved conversion rules; raw readings cannot simply be added together.
Total output, good output, warehouse-receipt quantity and equivalent output answer different questions. Process improvement generally needs to focus on good output while also showing the effects of rework and scrap. Financial or business allocation may use other rules, and these bases must not be interchanged without explanation.
| Boundary item | What must be defined | Common distortion | Improvement method |
|---|---|---|---|
| Energy boundary | Whether equipment itself, utilities, compressed air, HVAC and other loads are included | Metering only the main machine but comparing it with historical whole-line data | Map metering points to energy-consuming objects |
| Time boundary | How shifts, lots, work orders and calendar periods align | Hourly electricity readings misaligned with shift-based output | Unify time zones, clocks and period-splitting rules |
| Output boundary | How total output, good output, warehouse receipts and rework are handled | Counting reworked products more than once | Retain production events and quality status |
| Product boundary | Whether processes and energy use are comparable across products | Simply adding unit counts for comparison | Analyze by product or use approved equivalence rules |
| Nonproduction states | How standby, idling, heat retention and planned stops are classified | Allocating all standby energy to a small amount of output | Show base load and state-based energy separately |
Metering Points, Clocks and Data Quality Determine Whether the Formula Is Usable
Energy metering requires knowing which equipment or areas each meter serves, its multiplier and units, and whether the reading is instantaneous power or cumulative consumption. Cumulative-meter calculations must handle resets, replacements, backward readings and communication gaps; power curves require checks of sampling and integration methods.
Output data from MES, counters or manual reporting must align with the energy timeline. Inconsistent equipment clocks, server time zones and shift boundaries mismatch energy and output at the edges. Missing data should be marked unknown or estimated, never automatically filled with zero and then used for rankings.
| Data object | Minimum verification | Abnormality signal | Handling principle |
|---|---|---|---|
| Cumulative-meter readings | Multiplier, unit, start and end values, and meter range | Reset, replacement, backward reading or long gap | Retain raw values and apply controlled corrections |
| Power and flow | Sampling, integration, range and quality flags | Flat values, jumps, out-of-range values or stale data | Mark invalid and inspect the instrument and communication path |
| Total and good output | Product, lot, operation and counting events | Duplicate reporting, duplicated rework and omissions | Reconcile against the system of record |
| Equipment status | Running, standby, stopped and process operating conditions | Energy without status or output without energy | Check mappings, clocks and metering boundaries |
| Environment and operating conditions | Necessary environmental, product and production conditions | Unrecorded contextual differences between comparison periods | Add context or restrict the comparison scope |
Utilities and Shared Energy Cannot Be Allocated by Arbitrary Averages
Compressed-air stations, heating and cooling sources, HVAC, and water and wastewater utilities may serve several lines simultaneously. Simple average allocation makes unit energy consumption vary with output on other lines and says nothing about improvement on the line being analyzed. Prioritize submetering, allocation using explainable drivers, or separate plant-level analysis.
The allocation method must state its basis and limitations—for example, allocation by running time, rated equipment capacity, actual flow or another confirmed driver. Rated-capacity allocation is useful for estimation but is not measurement. For objects that cannot be split reliably, analysis at a higher boundary is often more credible than manufacturing precise figures.
- Meter directly first: check whether critical lines or major energy users can be measured independently.
- Then select drivers: allocate shared energy using an available basis related to the consumption mechanism.
- Show base load separately: heat retention, standby, leaks and fixed utilities do not all vary linearly with output.
- Disclose estimates: every allocation and imputation carries its method, version and uncertainty note.
- Avoid duplication: reconcile submeter totals with the main meter regularly to detect omissions and double counting.
A Comparable Baseline Normalizes Product, Output and Operating Conditions
Unit energy consumption is inherently affected by utilization and fixed loads. At lower output, heat retention, idling and utility base consumption are spread over fewer units, so the unit value may rise. This does not necessarily mean equipment efficiency has deteriorated; conversely, higher output does not prove that a specific energy-saving measure worked.
Improvement validation should use the same product, similar operating conditions and consistent boundaries wherever possible, with an energy model containing fixed and variable terms where needed. Whether weather, shift, batch size and startup count belong in the model depends on the process. When comparability is inadequate, describe only observed facts and do not publish an inferred savings percentage.
| Comparison scenario | Why direct comparison is invalid | Recommended handling | Acceptable conclusion format |
|---|---|---|---|
| Different products | Process routes, cycles and quality requirements differ | Separate by product or use an approved equivalence model | State the product scope and conversion method |
| Different output levels | Fixed loads and startup losses are allocated differently | Normalize utilization and base load | Distinguish fixed from variable consumption |
| Different environments | Temperature, humidity and other conditions may affect utilities and processes | Select similar conditions or establish normalization | Disclose environmental variables and model boundaries |
| Before and after equipment modification | Metering points and output definitions may change at the same time | Freeze definitions and check measurement consistency | Use like-for-like comparison and continued validation |
| Between production lines | Automation, products and utility boundaries differ | Prioritize each line's longitudinal improvement | Do not rank unconditionally across lines |
Break Unit Energy Consumption Down into Actionable Losses
Unit energy consumption provides only an outcome. Improvement also requires aligning energy with equipment states, process conditions and production events. Idling, standby, nonproduction heat retention, repeated starts, rework and abnormal operating conditions are all analytical clues, but process and safety conditions determine whether they are avoidable losses.
For example, energy without output may indicate idling or necessary heating and heat retention. Rework increases both processing and utility consumption, but reducing it requires quality and process actions. An energy system provides timelines and decomposition evidence; it cannot automatically issue equipment-control commands or guarantee benefits.
- Break down by state: observe production, standby, idling, stopped, startup and abnormal states separately.
- Break down by object: check main machines, utilities and shared systems separately to avoid boundary confusion.
- Link by event: align changeovers, failures, rework, starts and stops, and product switches with the curves.
- Form countermeasures: prioritize verified leaks, idling, parameter or scheduling mechanisms.
- Validate results: hold boundaries and comparable conditions constant, observe energy and check quality and delivery at the same time.
Start with One Model Line Where Energy and Output Align
Choose a line with clear metering and available output data, then map energy points, equipment states and product output. After data reconciliation, define shift- or lot-based unit energy consumption and base-load views rather than beginning with complex plant-wide allocation.
ORPAON can provide project-scoped energy-data acquisition, monitoring, statistics and analysis. The exact EMS product form and extensions must be confirmed by project. Going live is only the start of establishing a baseline and evidence chain; every energy-saving result must be validated with actual operating data.
- Step 1: map energy-consuming objects, metering points and output sources.
- Step 2: calibrate multipliers, units, clocks, shifts and product identities.
- Step 3: reconcile submeters with main meters, and reported output with physical items or system-of-record entries.
- Step 4: publish unit-energy and state-decomposition views with boundary notes.
- Step 5: validate a comparable baseline through model improvements before deciding on rollout and automation scope.
Unit Energy Consumption Is Definition Engineering First and a Ranking Metric Second
Unit energy consumption equals energy within a boundary divided by corresponding output, but unclear energy, time, product, quality or utility boundaries destroy comparability. Direct metering, data reconciliation and abnormality flags matter more than complex formulas.
Real improvement connects energy with state, process, output and quality events and validates results against a comparable baseline. Start with one clearly bounded model line to establish trusted data, then expand utility allocation and analysis gradually, avoiding misreadings of definition changes as energy-saving achievements.
Frequently asked questions
Should the denominator for unit energy consumption be total output or good output?
It depends on the analytical purpose. Good output is more explanatory when useful output and quality losses are the focus; other business definitions may use warehouse receipts or total output. The key is to disclose the definition, avoid double-counting rework and avoid comparisons across different bases.
Can different energy types be added directly to calculate unit energy consumption?
Raw physical readings cannot be added directly. For aggregate energy or carbon metrics, use approved standard-equivalent conversion or emission-factor rules while retaining each source's raw data and conversion version.
If lower output raises unit energy consumption, does that prove equipment deterioration?
Not necessarily. Fixed loads, heat retention and standby increase unit allocation at lower output. Separate fixed and variable consumption and normalize product, operating and utilization conditions before judging.
How long after an energy dashboard goes live can energy savings be proven?
There is no universal time commitment. Establish a reliable baseline first, then validate specific measures under comparable products, operating conditions and metering boundaries. The dashboard supplies evidence tools; it does not automatically generate savings.